
TL;DR:
- A rental management dashboard consolidates key property data into a single, real-time interface, enabling proactive decision-making. It streamlines workflows by automating data from multiple sources, reducing manual effort and increasing trust in metrics. Proper implementation and regular team reviews ensure the dashboard enhances occupancy, reduces vacancy, and optimizes rental yields.
If you are managing rentals from a tangle of spreadsheets, inbox threads, and sticky notes, you already know the cost: missed follow-ups, forgotten lease renewals, and no clear picture of where your money actually stands. A rental management dashboard solves this by pulling occupancy data, rent collection, maintenance requests, and lease timelines into one screen you can act on immediately. This guide breaks down exactly what these dashboards are, which metrics matter most, how they fit into your daily workflow, and what separates the ones that actually get used from the ones that collect digital dust.
Table of Contents
- What is a rental management dashboard?
- Core metrics tracked on rental management dashboards
- How rental management dashboards streamline property management workflows
- Key challenges and best practices for effective rental management dashboards
- A deeper perspective: why many rental management dashboards fail and how to succeed
- Choosing and implementing the right rental management dashboard for your rental business
- How Room Rental Manager supports rental management dashboards
- Frequently asked questions
Key Takeaways
| Point | Details |
|---|---|
| Centralized data access | Rental management dashboards provide a single screen for critical property metrics consolidating multiple data sources. |
| Track essential KPIs | Focus on occupancy, rent collection, maintenance backlog, lease expirations, and NOI for effective property oversight. |
| Boost operational efficiency | Dashboards reduce time spent on manual spreadsheets and multi-system logins by automating data updates. |
| Integrate with workflows | Successful dashboards are tightly connected to rental operations like rent tracking and maintenance requests to drive adoption. |
| Choose reliable solutions | Trustworthy dashboards depend on aligned data models and regular refresh schedules to maintain user confidence. |
What is a rental management dashboard?
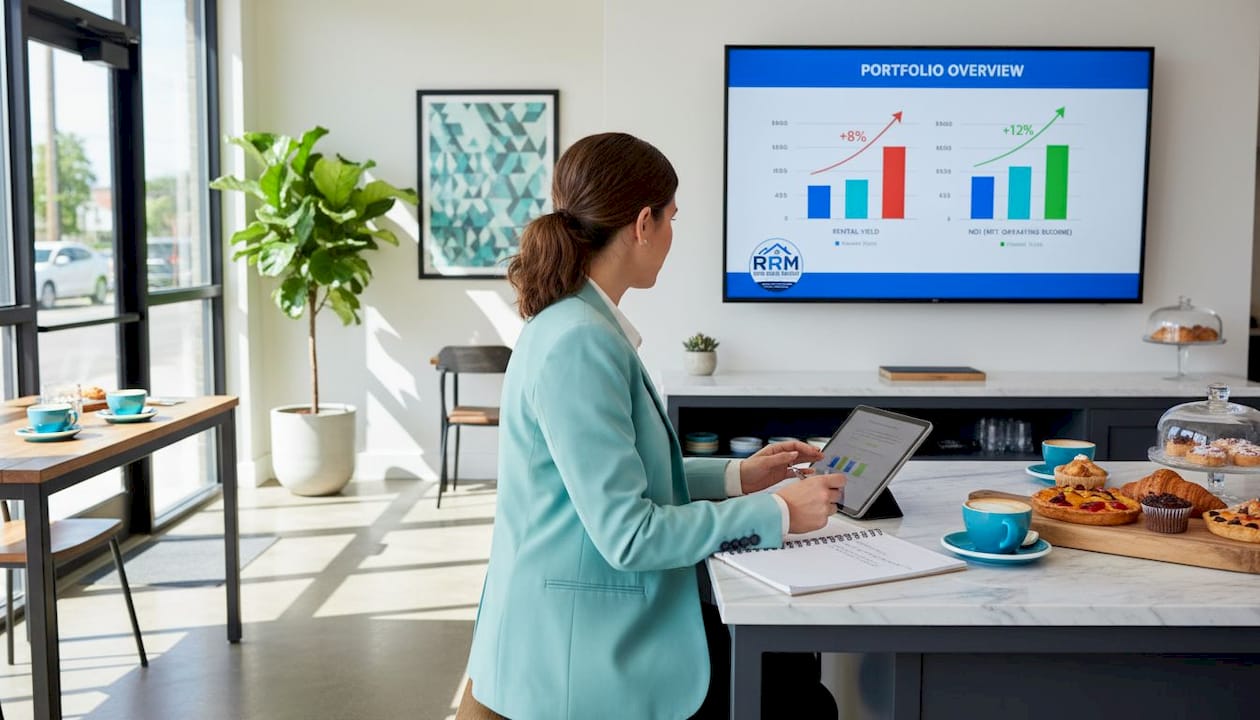
A rental management dashboard is a centralized, visual interface that consolidates key rental property data into one single screen for quick insight on property performance and needed actions. Think of it as the control room for your entire portfolio. Instead of logging into your accounting software for revenue numbers, then opening a separate maintenance app to check work orders, then digging through email threads to confirm lease dates, everything lives in one place.
This is not just a reporting layer that generates PDFs once a month. A well-built dashboard is an operations tool. It updates regularly, surfaces what needs attention today, and gives you a single answer to the question: "How are my properties actually doing right now?"
Here is what a rental management dashboard typically consolidates:
- Occupancy status across every unit or room in your portfolio
- Rent collection totals, outstanding balances, and delinquency aging by tenant
- Maintenance work orders including open tickets and how long they have been open
- Lease timelines showing upcoming expirations and renewal status
- Net operating income (NOI) updated from actual income and expense data
- Incoming inquiries and leads from prospective tenants
The role of a dashboard in rental management is not to replace your judgment. It is to make sure you are never operating blind. When you can see all of this at a glance, you stop reacting and start making decisions ahead of problems.
Core metrics tracked on rental management dashboards
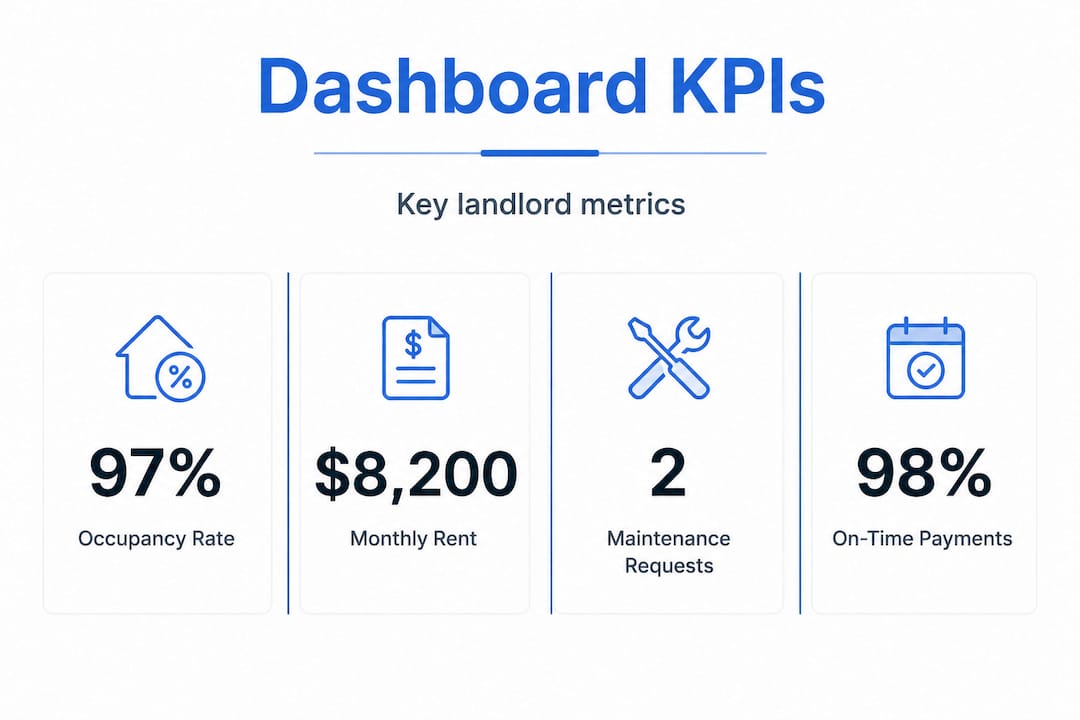
Not all data points on a dashboard are equally useful. Core dashboard KPIs include occupancy rate, rent collection and delinquency aging, work order backlog, lease expiration pipeline, renewal rate, and NOI. These are the numbers that drive actual decisions week to week.
Here is how each one connects to real action:
- Occupancy rate: Tells you which units are vacant and for how long. If a unit has been empty more than three weeks, that is a pricing or marketing problem that needs addressing now.
- Rent collection rate and delinquency aging: Shows not just who is late, but how late. A tenant who is 4 days past due is a different conversation than one who is 30 days out.
- Work order backlog and mean time to repair (MTTR): A growing backlog signals a staffing or vendor problem before it becomes a lease-breaking complaint.
- Lease expiration pipeline: Gives you 60 to 90 days of advance visibility so you are not scrambling to fill units at the last minute.
- Net operating income (NOI): The bottom line per property after operating expenses. This is the number that tells you whether a property is actually profitable.
| KPI | What it measures | Decision it drives |
|---|---|---|
| Occupancy rate | Percentage of units filled | Pricing and marketing adjustments |
| Rent delinquency aging | Days overdue per tenant | Collections outreach timing |
| Work order backlog | Open maintenance tickets | Vendor capacity and staffing |
| Lease expiration pipeline | Upcoming renewals in 60-90 days | Proactive renewal offers |
| NOI | Revenue minus operating costs | Hold, sell, or reinvest decisions |
Understanding rental yield importance in context of your NOI makes the numbers even more actionable. A property with strong occupancy but poor NOI usually has a maintenance or expense problem hiding in plain sight.
KPIs must connect to decisions and specific time horizons. A metric no one looks at or acts on is just noise taking up screen space.
Pro Tip: Set a weekly 15-minute review of your dashboard. Focus only on the metrics that changed significantly since last week. This prevents dashboard fatigue and keeps your attention on what actually moved.
How rental management dashboards streamline property management workflows
The most underappreciated benefit of a dashboard is not what it shows. It is the time it saves by replacing fragmented routines. Dashboards reduce time spent logging into multiple systems and managing spreadsheets by providing automatically updating, decision-ready views.
Here is a practical look at how that plays out:
- Unified data from multiple sources. Your property management system, accounting software, and maintenance log each hold pieces of the picture. A good dashboard pulls these together automatically, so you are not manually copying numbers between files.
- Automated views that stay current. Rather than running a report on demand, the dashboard updates on a set schedule, so when you open it Monday morning the numbers reflect the weekend's activity.
- Single-screen approvals and tracking. You can approve a maintenance request, check that last month's rent was collected, and confirm a lease renewal is in progress without leaving the dashboard.
- Team alignment through shared visibility. When your property manager, maintenance coordinator, and leasing agent all see the same data, your weekly standup stops being a status update meeting and starts being a decision meeting.
- Inquiry and lead tracking in one place. Rental inquiry tracking software that feeds into your dashboard means you can see how many prospective tenants are in the pipeline and where they came from, without sorting through emails.
Front-line adoption depends more on workflow integration than on how the dashboard looks. A beautiful interface no one actually uses during their workday is worthless. The best dashboards become the default starting point for your day, not an extra tool you open occasionally.
Pro Tip: Tie your dashboard review to an existing routine, such as your morning coffee or start-of-shift check-in. Habit stacking is more reliable than scheduling a separate "dashboard review" that gets skipped when things get busy.
Key challenges and best practices for effective rental management dashboards
A dashboard is only as good as the data feeding it. Dashboards are only effective if data from leasing, accounting, and maintenance systems align correctly. When they do not, users stop trusting the numbers and revert to spreadsheets.
The most common failure points:
- Mismatched identifiers. Your property management system calls Unit 2B "Unit 2B." Your accounting software calls it "2B-REAR." The maintenance app calls it "Second Floor Back." These mismatches break data joins and produce wrong or missing numbers.
- Stale refresh schedules. A rent delinquency figure that is three days old is not useful on the fifth of the month when late fees are due. Most reliable dashboards align their refresh schedules to leasing cadence, maintenance updates, and monthly financial closings.
- Too many metrics. Dashboards that show 40 KPIs train users to ignore all of them. Start with five to seven that directly connect to weekly decisions.
- No ownership. Someone on your team should be responsible for confirming the dashboard is accurate. If nobody owns it, data quality drifts.
"If a dashboard can't reliably update and is not integrated into daily workflows, teams stop using it and return to spreadsheets."
Here is a direct comparison of what separates a useful dashboard from a liability:
| Factor | Spreadsheet approach | Effective rental dashboard |
|---|---|---|
| Data freshness | Updated manually, often days old | Automated updates on set schedule |
| Trustworthiness | Depends on who last touched the file | Consistent source of truth |
| Usability | High effort to maintain | Low effort, high visibility |
| Workflow integration | Separate from daily operations | Embedded into daily routines |
| Error risk | High, human entry errors | Lower, automated data pulls |
For rental software reliability, the bar is simple: if you have to question whether a number is current, the tool is not doing its job.
A deeper perspective: why many rental management dashboards fail and how to succeed
Most articles about dashboards focus on features: charts, filters, color-coded alerts. That is the wrong place to put your attention. The dashboards that fail do not fail because the pie chart was the wrong shade of blue. They fail because the data feeding them is late, broken, or disconnected from how the team actually works.
Data latency is the quiet killer. When a maintenance ticket gets closed in your field app but the dashboard still shows it as open 36 hours later, your team stops trusting the dashboard. Once trust breaks, people revert to email threads and spreadsheets, and the tool becomes shelfware. Fixing the visual design after that point does nothing.
The second failure mode is buying a dashboard that impresses in a demo but does not map to your actual workflow. If your team tracks rent via text message confirmations and your dashboard only pulls from an integrated payment processor, there will always be a gap. Teams stop using tools that do not reflect how work actually happens.
What actually works is less glamorous. Align your dashboard's refresh schedule with your operational calendar. If rent is due on the first and you close books on the fifth, your dashboard should pull fresh financial data on the sixth, not on a random 24-hour cycle. If your maintenance vendor logs updates on Fridays, build your maintenance KPI review around that, not around a Monday morning metric that is already four days stale.
The landlords and property managers who get the most out of rental management insights are the ones who anchor a recurring team review to dashboard data. Not a monthly deep-dive nobody has time for. A weekly 20-minute check where the dashboard is the agenda. Occupancy changes? Discuss. Delinquency aging past 10 days? Assign. Work orders over 5 days open? Escalate. When the dashboard drives the conversation, it earns its place in the workflow.
Choosing and implementing the right rental management dashboard for your rental business
Once you understand what the dashboard needs to do, picking the right one becomes a more practical exercise. Analytics dashboards reduce vacancy by up to 60%, save 20-plus hours per listing, and improve lead conversions through automation and real-time data. But those results come from dashboards that are chosen carefully and implemented with intention.
Here is how to approach the selection and rollout:
- Map your current data sources first. List every system you use today: property management software, accounting, maintenance apps, leasing platforms. Any dashboard you choose must connect to these or the data gaps will undermine the whole thing.
- Prioritize integration reliability over feature count. A dashboard with five reliably updated KPIs beats one with 30 metrics that sync inconsistently.
- Look for real-time or near real-time KPI updates. Especially for rent collection and maintenance, anything more than 24 hours stale creates operational blind spots.
- Plan three weeks of onboarding, not three days. The first week is setup and data validation. The second is team training with real data. The third is the first live operational review anchored to the dashboard.
- Start with your highest-priority metrics. Vacancy rate, rent delinquency, and maintenance backlog for most landlords. Add more once those are trusted and acted on consistently.
Key features to look for in lead management software and dashboard tools include:
- Automated lead capture from your listings with source tracking
- Inquiry follow-up tracking so no prospect falls through the cracks
- Vacancy and turnover rate visibility tied to actual unit data
- Maintenance cost tracking per unit or property
- Tenant communication logs in one place rather than across multiple inboxes
The goal is a single tool you and your team actually open every day, not a collection of impressive features you demo once and never use again.
How Room Rental Manager supports rental management dashboards
Managing multiple room rentals means fielding the same questions dozens of times across texts, emails, Facebook messages, and Craigslist replies. Room Rental Manager cuts through that by giving you one clean listing page to share with every prospective tenant, so your rental inquiry tracking is automatic rather than manual.
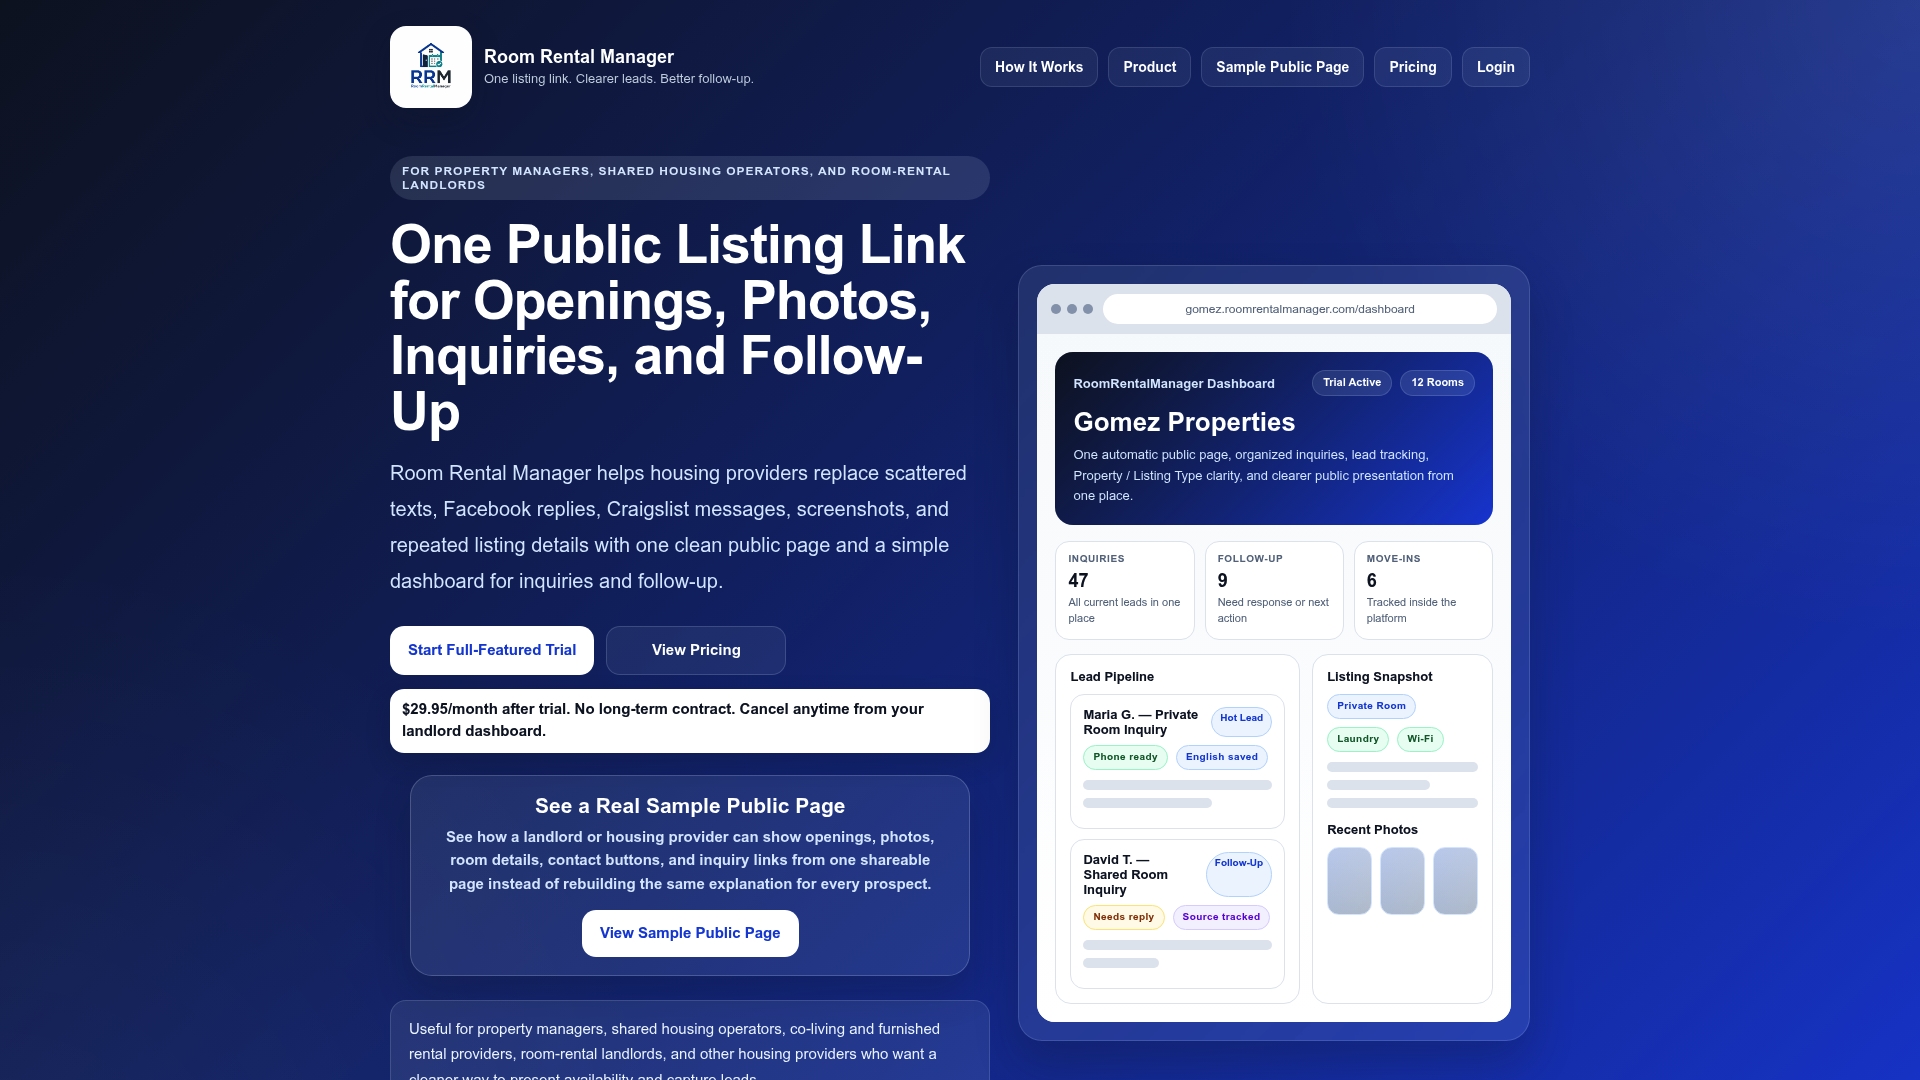
From your dashboard, you capture leads, see where they came from, and manage follow-up without toggling between platforms. The lead management software is built specifically for room rental landlords who do not need enterprise-level complexity but do need reliable visibility into who is interested, who has gone cold, and which listings are performing. Explore the full room rental landlord resources to see how landlords are replacing scattered workflows with one link and one dashboard.
Frequently asked questions
What is a rental management dashboard?
It is a centralized digital interface that consolidates key rental property data like occupancy, rent collection, maintenance, and lease details into one view. As defined in property management best practices, a rental management dashboard provides a single screen for quick insight and action.
Which key metrics should landlords track on these dashboards?
Landlords should focus on occupancy rates, rent collection and delinquency aging, maintenance backlogs, lease expirations, and net operating income. Core dashboard KPIs tie directly to daily and monthly decisions that affect both cash flow and tenant retention.
How do rental management dashboards save time for property managers?
They automate data consolidation from multiple systems and provide regularly updated views, eliminating manual spreadsheet work and repeated logins. Automatically updating dashboards mean your morning check-in gives you a current picture rather than yesterday's numbers.
What challenges exist when implementing rental management dashboards?
The main hurdles are data mismatches across systems and misaligned refresh schedules that produce outdated numbers. These data integration issues erode team trust quickly, which is why aligning identifiers and update timing across all connected tools matters from day one.
Can rental dashboards improve tenant retention and vacancy rates?
Yes. Dashboards with real-time analytics help you spot maintenance delays, track renewal timelines, and adjust pricing before units sit vacant. Property managers report vacancy reductions of 60% and meaningful rental yield improvements through consistent, data-driven management.